Mover el eje x a la parte superior de un gráfico en matplotlib
Basado en esta pregunta sobre mapas de calor en matplotlib, quería mover los títulos del eje x a la parte superior de la gráfica.
import matplotlib.pyplot as plt
import numpy as np
column_labels = list('ABCD')
row_labels = list('WXYZ')
data = np.random.rand(4,4)
fig, ax = plt.subplots()
heatmap = ax.pcolor(data, cmap=plt.cm.Blues)

# put the major ticks at the middle of each cell
ax.set_xticks(np.arange(data.shape[0])+0.5, minor=False)
ax.set_yticks(np.arange(data.shape[1])+0.5, minor=False)

# want a more natural, table-like display
ax.invert_yaxis()
ax.xaxis.set_label_position('top') # <-- This doesn't work!

ax.set_xticklabels(row_labels, minor=False)
ax.set_yticklabels(column_labels, minor=False)
plt.show()
Sin embargo, llamar a set_label_position de matplotlib (como se indica anteriormente) no parece tener el efecto deseado. Aquí está mi salida:
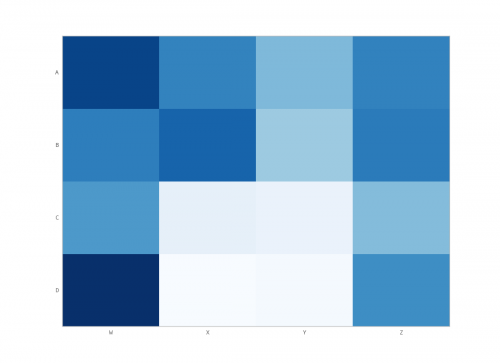
¿Qué estoy haciendo mal?
4 answers
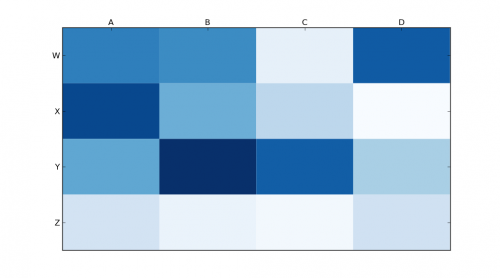
Use
ax.xaxis.tick_top()
Para colocar las marcas en la parte superior de la imagen. El comando
ax.set_xlabel('X LABEL')
ax.xaxis.set_label_position('top')
Afecta a la etiqueta, no a las marcas.
import matplotlib.pyplot as plt
import numpy as np
column_labels = list('ABCD')
row_labels = list('WXYZ')
data = np.random.rand(4, 4)
fig, ax = plt.subplots()
heatmap = ax.pcolor(data, cmap=plt.cm.Blues)

# put the major ticks at the middle of each cell
ax.set_xticks(np.arange(data.shape[1]) + 0.5, minor=False)
ax.set_yticks(np.arange(data.shape[0]) + 0.5, minor=False)

# want a more natural, table-like display
ax.invert_yaxis()
ax.xaxis.tick_top()

ax.set_xticklabels(column_labels, minor=False)
ax.set_yticklabels(row_labels, minor=False)
plt.show()
Warning: date(): Invalid date.timezone value 'Europe/Kyiv', we selected the timezone 'UTC' for now. in /var/www/agent_stack/data/www/ajaxhispano.com/template/agent.layouts/content.php on line 61
2013-03-12 22:05:28
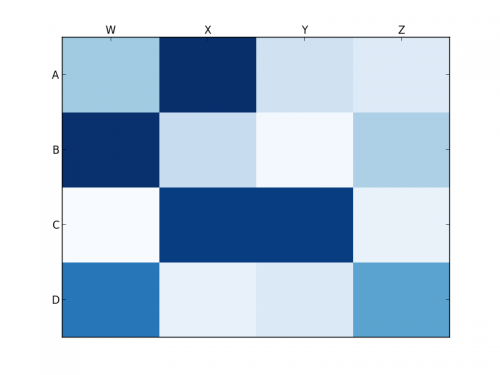
Usted quiere set_ticks_position en lugar de set_label_position:
ax.xaxis.set_ticks_position('top') # the rest is the same
Esto me da:
Warning: date(): Invalid date.timezone value 'Europe/Kyiv', we selected the timezone 'UTC' for now. in /var/www/agent_stack/data/www/ajaxhispano.com/template/agent.layouts/content.php on line 61
2013-01-18 19:42:31
Tick_params es muy útil para establecer propiedades de tick. Las etiquetas se pueden mover a la parte superior con:
ax.tick_params(labelbottom='off',labeltop='on')
Warning: date(): Invalid date.timezone value 'Europe/Kyiv', we selected the timezone 'UTC' for now. in /var/www/agent_stack/data/www/ajaxhispano.com/template/agent.layouts/content.php on line 61
2013-10-03 08:40:18
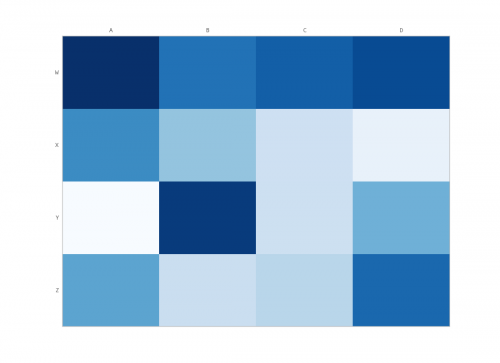
Tienes que hacer un masaje adicional si quieres que las garrapatas (no las etiquetas) aparezcan en la parte superior e inferior (no solo en la parte superior). La única manera que podría hacer esto es con un cambio menor en el código de unutbu:
import matplotlib.pyplot as plt
import numpy as np
column_labels = list('ABCD')
row_labels = list('WXYZ')
data = np.random.rand(4, 4)
fig, ax = plt.subplots()
heatmap = ax.pcolor(data, cmap=plt.cm.Blues)

# put the major ticks at the middle of each cell
ax.set_xticks(np.arange(data.shape[1]) + 0.5, minor=False)
ax.set_yticks(np.arange(data.shape[0]) + 0.5, minor=False)

# want a more natural, table-like display
ax.invert_yaxis()
ax.xaxis.tick_top()
ax.xaxis.set_ticks_position('both') # THIS IS THE ONLY CHANGE

ax.set_xticklabels(column_labels, minor=False)
ax.set_yticklabels(row_labels, minor=False)
plt.show()
Salida:
Warning: date(): Invalid date.timezone value 'Europe/Kyiv', we selected the timezone 'UTC' for now. in /var/www/agent_stack/data/www/ajaxhispano.com/template/agent.layouts/content.php on line 61
2013-05-08 01:45:54