Herramienta de trazado / trazado basado en Unix ASCII de línea de comandos
¿Existe una buena herramienta de gráficos / gráficos / gráficos de línea de comandos de UNIX? Estoy buscando algo que trazará puntos xy en un gráfico ASCII.
Solo para aclarar, estoy buscando algo que genere un gráfico en ASCII (como el estilo ascii-art), por lo que puedo usarlo sobre una sesión de shell interactiva sin necesidad de X.
10 answers
Intenta gnuplot. Tiene posibilidades gráficas muy poderosas.
Puede generar la salida a su terminal de la siguiente manera:
gnuplot> set terminal dumb
Terminal type set to 'dumb'
Options are 'feed 79 24'
gnuplot> plot sin(x)

   1 ++----------------**---------------+----**-----------+--------**-----++
     +                *+ *              +   *  *          +  sin(x) ****** +
 0.8 ++              *    *                *    *                *    *   ++
     |               *    *                *    *                *    *    |
 0.6 ++              *     *              *      *              *      *  ++
     *              *       *             *       *             *      *   |
 0.4 +*             *       *             *       *             *      *  ++
     |*            *        *            *        *            *        *  |
 0.2 +*            *        *            *        *            *        * ++
     | *          *          *          *          *          *          * |
   0 ++*          *          *          *          *          *          *++
     |  *         *           *         *           *         *           *|
-0.2 ++ *         *           *         *           *         *           *+
     |   *       *            *        *            *        *            *|
-0.4 ++  *       *            *        *            *        *            *+
     |   *      *              *      *              *      *              *
-0.6 ++  *      *              *      *              *      *             ++
     |    *     *               *     *               *    *               |
-0.8 ++    *   *                 *   *                *    *              ++
     +     *  *        +         *  *   +              *  *                +
  -1 ++-----**---------+----------**----+---------------**+---------------++
    -10               -5                0                 5                10
Warning: date(): Invalid date.timezone value 'Europe/Kyiv', we selected the timezone 'UTC' for now. in /var/www/agent_stack/data/www/ajaxhispano.com/template/agent.layouts/content.php on line 61
2008-09-23 20:20:40
Mientras que gnuplot es poderoso, también es realmente irritante cuando solo quieres canalizar un montón de puntos y obtener un gráfico.
Afortunadamente, alguien creó eplot (easy plot), que maneja todas las tonterías por ti.
No parece tener una opción para forzar gráficos terminales; lo parcheé así:
--- eplot.orig  2012-10-12 17:07:35.000000000 -0700
+++ eplot       2012-10-12 17:09:06.000000000 -0700
@@ -377,6 +377,7 @@
                # ---- print the options
                com="echo '\n"+getStyleString+@oc["MiscOptions"]
                com=com+"set multiplot;\n" if doMultiPlot
+               com=com+"set terminal dumb;\n"
                com=com+"plot "+@oc["Range"]+comString+"\n'| gnuplot -persist"
                printAndRun(com)
                # ---- convert to PDF
Un ejemplo de uso:
[$]> git shortlog -s -n | awk '{print $1}' | eplot 2> /dev/null


  3500 ++-------+-------+--------+--------+-------+--------+-------+-------++
       +        +       +        "/tmp/eplot20121012-19078-fw3txm-0" ****** +       *                                                                    |  3000 +*                                                                  ++       |*                                                                   |       | *                                                                  |  2500 ++*                                                                 ++       | *                                                                  |
       |  *                                                                 |
  2000 ++ *                                                                ++
       |  **                                                                |
  1500 ++   ****                                                           ++
       |        *                                                           |
       |         **                                                         |
  1000 ++          *                                                       ++
       |            *                                                       |
       |            *                                                       |
   500 ++            ***                                                   ++
       |                **************                                      |
       +        +       +        +    **********  +        +       +        +
     0 ++-------+-------+--------+--------+-----***************************++
       0        5       10       15       20      25       30      35       40
Warning: date(): Invalid date.timezone value 'Europe/Kyiv', we selected the timezone 'UTC' for now. in /var/www/agent_stack/data/www/ajaxhispano.com/template/agent.layouts/content.php on line 61
2012-10-13 00:18:00
Otra opción que acabo de encontrar es bashplotlib. Aquí hay un ejemplo que se ejecuta en (aproximadamente) los mismos datos que mi ejemplo de eplot :
[$]> git shortlog -s -n | awk '{print $1}' | hist

 33|   o
 32|   o
 30|   o
 28|   o
 27|   o
 25|   o
 23|   o
 22|   o
 20|   o
 18|   o
 16|   o
 15|   o
 13|   o
 11|   o
 10|   o
  8|   o
  6|   o
  5|   o
  3|   o o     o
  1|   o o     o o       o
  0|   o o o o o o       o
    ----------------------

-----------------------
|       Summary       |
-----------------------
|   observations: 50  |
| min value: 1.000000 |
|  mean : 519.140000  |
|max value: 3207.000000|
-----------------------
Ajustar los contenedores ayuda un poco a la resolución:
[$]> git shortlog -s -n | awk '{print $1}' | hist --nosummary --bins=40

 18|   o
   |   o
 17|   o
 16|   o
 15|   o
 14|   o
 13|   o
 12|   o
 11|   o
 10|   o
  9|   o
  8|   o
  7|   o
  6|   o
  5|   o   o
  4|   o   o o
  3|   o o o o   o
  2|   o o o o   o
  1|   o o o o   o                     o       o
  0|   o o o o o o           o     o   o o   o o                                 o
   |   o o o o o o           o     o   o o   o o                                 o
    --------------------------------------------------------------------------------
Warning: date(): Invalid date.timezone value 'Europe/Kyiv', we selected the timezone 'UTC' for now. in /var/www/agent_stack/data/www/ajaxhispano.com/template/agent.layouts/content.php on line 61
2017-05-23 12:34:09
Las gráficas en una sola línea son realmente simples, y pueden ayudar a ver patrones de altos y bajos.
Véase también pysparklines.
(¿Alguien sabe de líneas inclinadas unicode, que podrían encajar entre sí para hacer
línea, no bar, parcelas ?)
#!/usr/bin/env python
# -*- coding: utf-8 -*-

from __future__ import division
import numpy as np

__version__ = "2015-01-02 jan  denis"


#...............................................................................
def onelineplot( x, chars=u"▁▂▃▄▅▆▇█", sep=" " ):
    """ numbers -> v simple one-line plots like

f ▆ ▁ ▁ ▁ █ ▁ ▁ ▁ ▁ ▁ ▁ ▁ ▁ ▁ ▁ ▁ ▁ ▁ ▁ ▁  osc 47  ▄ ▁ █ ▇ ▄ ▆ ▅ ▇ ▇ ▇ ▇ ▇ ▄ ▃ ▃ ▁ ▃ ▂  rosenbrock
f █ ▅ █ ▅ █ ▅ █ ▅ █ ▅ █ ▅ █ ▅ █ ▅ ▁ ▁ ▁ ▁  osc 58  ▂ ▁ ▃ ▂ ▄ ▃ ▅ ▄ ▆ ▅ ▇ ▆ █ ▇ ▇ ▃ ▃ ▇  rastrigin
f █ █ █ █ ▁ ▁ ▁ ▁ ▁ ▁ ▁ ▁ ▁ ▁ ▁ ▁ ▁ ▁ ▁ ▁  osc 90  █ ▇ ▇ ▁ █ ▇ █ ▇ █ ▇ █ ▇ █ ▇ █ ▇ █ ▇  ackley

Usage:
    astring = onelineplot( numbers [optional chars= sep= ])
In:
    x: a list / tuple / numpy 1d array of numbers
    chars: plot characters, default the 8 Unicode bars above
    sep: "" or " " between plot chars

How it works:
    linscale x  ->  ints 0 1 2 3 ...  ->  chars ▁ ▂ ▃ ▄ ...

See also: https://github.com/RedKrieg/pysparklines
    """

    xlin = _linscale( x, to=[-.49, len(chars) - 1 + .49 ])
        # or quartiles 0 - 25 - 50 - 75 - 100
    xints = xlin.round().astype(int)
    assert xints.ndim == 1, xints.shape  # todo: 2d
    return sep.join([ chars[j] for j in xints ])


def _linscale( x, from_=None, to=[0,1] ):
    """ scale x from_ -> to, default min, max -> 0, 1 """
    x = np.asanyarray(x)
    m, M = from_ if from_ is not None \
        else [np.nanmin(x), np.nanmax(x)]
    if m == M:
        return np.ones_like(x) * np.mean( to )
    return (x - m) * (to[1] - to[0]) \
        / (M - m)  + to[0]


#...............................................................................
if __name__ == "__main__":  # standalone test --
    import sys

    if len(sys.argv) > 1:  # numbers on the command line, may be $(cat myfile)
        x = map( float, sys.argv[1:] )
    else:
        np.random.seed( 0 )
        x = np.random.exponential( size=20 )

    print onelineplot( x )
Warning: date(): Invalid date.timezone value 'Europe/Kyiv', we selected the timezone 'UTC' for now. in /var/www/agent_stack/data/www/ajaxhispano.com/template/agent.layouts/content.php on line 61
2015-01-02 11:48:36
Feedgnuplot es otro front-end de gnuplot, que maneja la canalización de datos.
    $ seq 5 | awk '{print 2*$1, $1*$1}' |
      feedgnuplot --lines --points --legend 0 "data 0" --title "Test plot" --y2 1
                  --terminal 'dumb 80,40' --exit

                                     Test plot

     10 ++------+--------+-------+-------+-------+--------+-------+------*A 25
        +       +        +       +       +       +        +       +    **#+
        |       :        :       :       :       :        : data 0+**A*** |
        |       :        :       :       :       :        :       :** #   |
      9 ++.......................................................**.##....|
        |       :        :       :       :       :        :    ** :#      |
        |       :        :       :       :       :        :  **   #       |
        |       :        :       :       :       :        :**   ##:      ++ 20
      8 ++................................................A....#..........|
        |       :        :       :       :       :      **:   #   :       |
        |       :        :       :       :       :    **  : ##    :       |
        |       :        :       :       :       :  **    :#      :       |
        |       :        :       :       :       :**      B       :       |
      7 ++......................................**......##................|
        |       :        :       :       :    ** :    ##  :       :      ++ 15
        |       :        :       :       :  **   :   #    :       :       |
        |       :        :       :       :**     : ##     :       :       |
      6 ++..............................*A.......##.......................|
        |       :        :       :    ** :     ##:        :       :       |
        |       :        :       :  **   :    #  :        :       :       |
        |       :        :       :**     :  ##   :        :       :      ++ 10
      5 ++......................**........##..............................|
        |       :        :    ** :      #B       :        :       :       |
        |       :        :  **   :    ## :       :        :       :       |
        |       :        :**     :  ##   :       :        :       :       |
      4 ++...............A.......###......................................|
        |       :      **:     ##:       :       :        :       :       |
        |       :    **  :   ##  :       :       :        :       :      ++ 5
        |       :  **    : ##    :       :       :        :       :       |
        |       :**    ##B#      :       :       :        :       :       |
      3 ++.....**..####...................................................|
        |    **####      :       :       :       :        :       :       |
        |  **## :        :       :       :       :        :       :       |
        B**     +        +       +       +       +        +       +       +
      2 A+------+--------+-------+-------+-------+--------+-------+------++ 0
        1      1.5       2      2.5      3      3.5       4      4.5      5
Warning: date(): Invalid date.timezone value 'Europe/Kyiv', we selected the timezone 'UTC' for now. in /var/www/agent_stack/data/www/ajaxhispano.com/template/agent.layouts/content.php on line 61
2015-02-18 17:41:14
Gnuplot es la respuesta definitiva a tu pregunta.
Personalmente también soy un gran fan de la google chart API, a la que se puede acceder desde la línea de comandos con la ayuda de wget (o curl) para descargar un archivo png (y ver con xview o algo similar). Me gusta esta opción porque encuentro que los gráficos son un poco más bonitos (es decir, mejor antialiasing).
Warning: date(): Invalid date.timezone value 'Europe/Kyiv', we selected the timezone 'UTC' for now. in /var/www/agent_stack/data/www/ajaxhispano.com/template/agent.layouts/content.php on line 61
2008-09-23 19:54:28
Warning: date(): Invalid date.timezone value 'Europe/Kyiv', we selected the timezone 'UTC' for now. in /var/www/agent_stack/data/www/ajaxhispano.com/template/agent.layouts/content.php on line 61
2008-09-23 19:53:52
Debe usar gnuplot y asegúrese de emitir el comando " set term dumb" después de empezar. También puede dar un recuento de filas y columnas. Aquí está la salida de gnuplot si emite " set term dumb 64 10" y luego "plot sin (x)":
    1 ++-----------****-----------+--***-------+------****--++
  0.6 *+          **+  *          +**   *      sin(x)*******++
  0.2 +*         *      *         **     **         *     **++
    0 ++*       **       *       **       *       **       *++
 -0.4 ++**     *         **     **         *      *         *+
 -0.8 ++ **   *     +      *   ** +         *  +**          +*
   -1 ++--****------+-------***---+----------****-----------++
     -10           -5             0            5             10
Se ve mejor en 79x24 (no use la columna 80 en una pantalla 80x24: algunas implementaciones de curses no siempre se comportan bien alrededor de la última columna).
Estoy usando gnuplot v4, pero esto debería funcionar en versiones un poco más antiguas o más nuevas.
Warning: date(): Invalid date.timezone value 'Europe/Kyiv', we selected the timezone 'UTC' for now. in /var/www/agent_stack/data/www/ajaxhispano.com/template/agent.layouts/content.php on line 61
2008-09-23 20:13:27
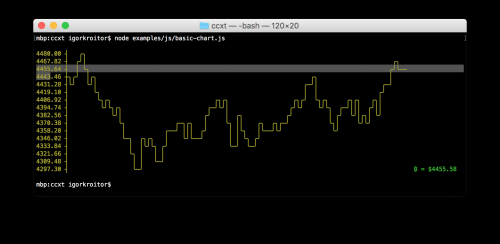
Ver también: asciichart (implementado en Node.js, Python, Java, Go y Haskell)
Warning: date(): Invalid date.timezone value 'Europe/Kyiv', we selected the timezone 'UTC' for now. in /var/www/agent_stack/data/www/ajaxhispano.com/template/agent.layouts/content.php on line 61
2018-07-28 06:01:42
Aquí está mi parche para eplot que agrega la opción a-T para la salida de terminal:
--- eplot       2008-07-09 16:50:04.000000000 -0400
+++ eplot+      2017-02-02 13:20:23.551353793 -0500
@@ -172,7 +172,10 @@
                                        com=com+"set terminal postscript color;\n"
                                        @o["DoPDF"]=true

-                               # ---- Specify a custom output file
+                               when /^-T$|^--terminal$/
+                                       com=com+"set terminal dumb;\n"
+
+                                # ---- Specify a custom output file
                                when /^-o$|^--output$/
                                        @o["OutputFileSpecified"]=checkOptArg(xargv,i)
                                        i=i+1

                                    i=i+1
Usando esto puede ejecutarlo como eplot -T para obtener el resultado ASCII-graphics en lugar de una ventana gnuplot.
Warning: date(): Invalid date.timezone value 'Europe/Kyiv', we selected the timezone 'UTC' for now. in /var/www/agent_stack/data/www/ajaxhispano.com/template/agent.layouts/content.php on line 61
2017-02-02 18:32:42