Extraer valores del coeficiente de regresión
Tengo un modelo de regresión para algunos datos de series temporales que investigan la utilización de drogas. El propósito es ajustar una spline a una serie temporal y calcular el IC del 95%, etc. El modelo es el siguiente:
id <- ts(1:length(drug$Date))
a1 <- ts(drug$Rate)
a2 <- lag(a1-1)
tg <- ts.union(a1,id,a2)
mg <-lm (a1~a2+bs(id,df=df1),data=tg)
La salida de resumen de mg es:
Call:
lm(formula = a1 ~ a2 + bs(id, df = df1), data = tg)

Residuals:
     Min       1Q   Median       3Q      Max
-0.31617 -0.11711 -0.02897  0.12330  0.40442

Coefficients:
                  Estimate Std. Error t value Pr(>|t|)
(Intercept)        0.77443    0.09011   8.594 1.10e-11 ***
a2                 0.13270    0.13593   0.976  0.33329
bs(id, df = df1)1 -0.16349    0.23431  -0.698  0.48832
bs(id, df = df1)2  0.63013    0.19362   3.254  0.00196 **
bs(id, df = df1)3  0.33859    0.14399   2.351  0.02238 *
---
Signif. codes:  0 '***' 0.001 '**' 0.01 '*' 0.05 '.' 0.1 ' ' 1
Estoy usando el valor Pr(>|t|) de a2 para probar si los datos bajo investigación son autocorrelacionados.
¿Es posible extraer este valor de Pr(>|t|) (en este modelo 0.33329) y almacenarlo en un escalar para realizar un ¿prueba?
Alternativamente, ¿se puede resolver usando otro método?
3 answers
Un objeto summary.lm almacena estos valores en un matrix llamado 'coefficients'. Así que el valor que buscas se puede acceder con:
a2Pval <- summary(mg)$coefficients[2, 4]
O, de manera más general/legible, coef(summary(mg))["a2","Pr(>|t|)"]. Vea aquí para saber por qué se prefiere este método.
Warning: date(): Invalid date.timezone value 'Europe/Kyiv', we selected the timezone 'UTC' for now. in /var/www/agent_stack/data/www/ajaxhispano.com/template/agent.layouts/content.php on line 61
2017-05-23 12:34:19
El paquete broom es útil aquí (utiliza el formato "tidy").
tidy(mg) dará una información muy bien formateada.marco con coeficientes, estadísticas de t, etc. Funciona también para otros modelos (por ejemplo, plm,...).
Ejemplo del repositorio de github de broom:
lmfit <- lm(mpg ~ wt, mtcars)
require(broom)
tidy(lmfit)

      term estimate std.error statistic   p.value
1 (Intercept)   37.285   1.8776    19.858 8.242e-19
2          wt   -5.344   0.5591    -9.559 1.294e-10

is.data.frame(tidy(lmfit))
[1] TRUE
Warning: date(): Invalid date.timezone value 'Europe/Kyiv', we selected the timezone 'UTC' for now. in /var/www/agent_stack/data/www/ajaxhispano.com/template/agent.layouts/content.php on line 61
2015-04-08 22:03:37
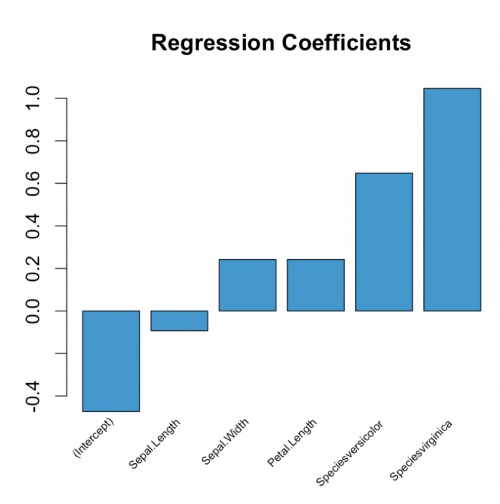
Simplemente pase su modelo de regresión a la siguiente función:
    plot_coeffs <- function(mlr_model) {
      coeffs <- coefficients(mlr_model)
      mp <- barplot(coeffs, col="#3F97D0", xaxt='n', main="Regression Coefficients")
      lablist <- names(coeffs)
      text(mp, par("usr")[3], labels = lablist, srt = 45, adj = c(1.1,1.1), xpd = TRUE, cex=0.6)
    }
Utilizar como sigue:
model <- lm(Petal.Width ~ ., data = iris)

plot_coeffs(model)
Warning: date(): Invalid date.timezone value 'Europe/Kyiv', we selected the timezone 'UTC' for now. in /var/www/agent_stack/data/www/ajaxhispano.com/template/agent.layouts/content.php on line 61
2017-02-19 05:39:50