Dibujando múltiples bordes entre dos nodos con d3
He estado siguiendo el código de Mike Bostock de este ejemplo para aprender a dibujar gráficos dirigidos en d3 y me preguntaba cómo estructuraría el código para poder agregar múltiples bordes entre dos nodos en el gráfico. Por ejemplo, si el conjunto de datos en el ejemplo anterior se definió como
var links = [{source: "Microsoft", target: "Amazon", type: "licensing"},
             {source: "Microsoft", target: "Amazon", type: "suit"},
             {source: "Samsung", target: "Apple", type: "suit"},
             {source: "Microsoft", target: "Amazon", type: "resolved"}];
Y luego ejecutar a través del código, todo lo que veo es una línea. Todas las rutas se están dibujando correctamente en el código html, sin embargo, todas tienen las mismas coordenadas y orientación que hace que el aspecto visual se vea como 1 línea. ¿Qué tipo de reestructuración de código tendría que hacerse en este ejemplo para permitir que los 3 bordes no se dibujen uno encima del otro?
2 answers
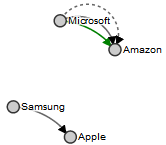
De hecho, la visualización original es un excelente ejemplo de un método para mostrar múltiples enlaces entre nodos, es decir, usar arcos en lugar de rutas directas, para que pueda ver tanto los enlaces entrantes como salientes.
Este concepto se puede extender para mostrar múltiples de cada uno de estos tipos de enlaces cambiando los valores de radio de los siguientes elementos svg path(arc) que representan el enlace. Un ejemplo básico es
dr = 75/d.linknum;
Donde d.linknum representa el número del enlace sucesivo. dr se utiliza más tarde como las cantidades rx y ry para el arco que se dibuja.
Plena aplicación aquí: http://jsfiddle.net/7HZcR/3 /
Warning: date(): Invalid date.timezone value 'Europe/Kyiv', we selected the timezone 'UTC' for now. in /var/www/agent_stack/data/www/ajaxhispano.com/template/agent.layouts/content.php on line 61
2012-07-08 05:26:59
Aquí está la fuente de la respuesta anterior si alguien la necesita :
var links = [{source: "Microsoft", target: "Amazon", type: "licensing"},
             {source: "Microsoft", target: "Amazon", type: "suit"},
             {source: "Samsung", target: "Apple", type: "suit"},
             {source: "Microsoft", target: "Amazon", type: "resolved"}];
//sort links by source, then target
links.sort(function(a,b) {
    if (a.source > b.source) {return 1;}
    else if (a.source < b.source) {return -1;}
    else {
        if (a.target > b.target) {return 1;}
        if (a.target < b.target) {return -1;}
        else {return 0;}
    }
});
//any links with duplicate source and target get an incremented 'linknum'
for (var i=0; i<links.length; i++) {
    if (i != 0 &&
        links[i].source == links[i-1].source &&
        links[i].target == links[i-1].target) {
            links[i].linknum = links[i-1].linknum + 1;
        }
    else {links[i].linknum = 1;};
};

var nodes = {};

// Compute the distinct nodes from the links.
links.forEach(function(link) {
  link.source = nodes[link.source] || (nodes[link.source] = {name: link.source});
  link.target = nodes[link.target] || (nodes[link.target] = {name: link.target});
});

var w = 600,
    h = 600;

var force = d3.layout.force()
    .nodes(d3.values(nodes))
    .links(links)
    .size([w, h])
    .linkDistance(60)
    .charge(-300)
    .on("tick", tick)
    .start();

var svg = d3.select("body").append("svg:svg")
    .attr("width", w)
    .attr("height", h);

// Per-type markers, as they don't inherit styles.
svg.append("svg:defs").selectAll("marker")
    .data(["suit", "licensing", "resolved"])
  .enter().append("svg:marker")
    .attr("id", String)
    .attr("viewBox", "0 -5 10 10")
    .attr("refX", 15)
    .attr("refY", -1.5)
    .attr("markerWidth", 6)
    .attr("markerHeight", 6)
    .attr("orient", "auto")
  .append("svg:path")
    .attr("d", "M0,-5L10,0L0,5");

var path = svg.append("svg:g").selectAll("path")
    .data(force.links())
  .enter().append("svg:path")
    .attr("class", function(d) { return "link " + d.type; })
    .attr("marker-end", function(d) { return "url(#" + d.type + ")"; });

var circle = svg.append("svg:g").selectAll("circle")
    .data(force.nodes())
  .enter().append("svg:circle")
    .attr("r", 6)
    .call(force.drag);

var text = svg.append("svg:g").selectAll("g")
    .data(force.nodes())
  .enter().append("svg:g");

// A copy of the text with a thick white stroke for legibility.
text.append("svg:text")
    .attr("x", 8)
    .attr("y", ".31em")
    .attr("class", "shadow")
    .text(function(d) { return d.name; });

text.append("svg:text")
    .attr("x", 8)
    .attr("y", ".31em")
    .text(function(d) { return d.name; });

// Use elliptical arc path segments to doubly-encode directionality.
function tick() {
  path.attr("d", function(d) {
    var dx = d.target.x - d.source.x,
        dy = d.target.y - d.source.y,
        dr = 75/d.linknum;  //linknum is defined above
    return "M" + d.source.x + "," + d.source.y + "A" + dr + "," + dr + " 0 0,1 " + d.target.x + "," + d.target.y;
  });

  circle.attr("transform", function(d) {
    return "translate(" + d.x + "," + d.y + ")";
  });

  text.attr("transform", function(d) {
    return "translate(" + d.x + "," + d.y + ")";
  });
}
path.link {
fill: none;
stroke: #666;
stroke-width: 1.5px;
}
marker#licensing {
fill: green;
}
path.link.licensing {
stroke: green;
}
path.link.resolved {
stroke-dasharray: 0,2 1;
}
circle {
fill: #ccc;
stroke: #333;
stroke-width: 1.5px;
}
text {
font: 10px sans-serif;
pointer-events: none;
}
text.shadow {
stroke: #fff;
stroke-width: 3px;
stroke-opacity: .8;
}<script src="https://cdnjs.cloudflare.com/ajax/libs/d3/3.4.11/d3.min.js"></script>
<div id="chart"></div>Warning: date(): Invalid date.timezone value 'Europe/Kyiv', we selected the timezone 'UTC' for now. in /var/www/agent_stack/data/www/ajaxhispano.com/template/agent.layouts/content.php on line 61
2015-10-08 10:27:56