cuente el número de filas en un marco de datos en R basado en el grupo [duplicar]
Esta pregunta ya tiene una respuesta aquí:
- Contar el número de filas dentro de cada grupo 11 respuestas
Tengo un marco de datos en R así:
  ID   MONTH-YEAR   VALUE
  110   JAN. 2012     1000
  111   JAN. 2012     2000
         .         .
         .         .
  121   FEB. 2012     3000
  131   FEB. 2012     4000
         .           .
         .           .
Por lo tanto, para cada mes de cada año hay n filas y pueden estar en cualquier orden(significa que todas no están en continuidad y están en descansos). Quiero calcular cuántas filas hay para cada MONTH-YEAR es decir, cuántas filas hay para JAN. 2012, ¿cuántos para FEBRERO. 2012 y así sucesivamente. Algo como esto:
 MONTH-YEAR   NUMBER OF ROWS
 JAN. 2012     10
 FEB. 2012     13
 MAR. 2012     6
 APR. 2012     9
Traté de hacer esto:
n_row <- nrow(dat1_frame %.% group_by(MONTH-YEAR))
Pero no produce la salida deseada.¿Cómo puedo hacer eso?
8 answers
Aquí hay un ejemplo que muestra cómo table(.) (o, más estrechamente coincidiendo con su salida deseada, data.frame(table(.)) hace lo que parece que está pidiendo.
Tenga en cuenta también cómo compartir datos de muestra reproducibles de una manera que otros puedan copiar y pegar en su sesión.
Aquí están los datos de muestra (reproducibles):
mydf <- structure(list(ID = c(110L, 111L, 121L, 131L, 141L),
                       MONTH.YEAR = c("JAN. 2012", "JAN. 2012",
                                      "FEB. 2012", "FEB. 2012",
                                      "MAR. 2012"),
                       VALUE = c(1000L, 2000L, 3000L, 4000L, 5000L)),
                  .Names = c("ID", "MONTH.YEAR", "VALUE"),
                  class = "data.frame", row.names = c(NA, -5L))

mydf
#    ID MONTH.YEAR VALUE
# 1 110  JAN. 2012  1000
# 2 111  JAN. 2012  2000
# 3 121  FEB. 2012  3000
# 4 131  FEB. 2012  4000
# 5 141  MAR. 2012  5000
Aquí está el cálculo del número de filas por grupo, en dos formatos de visualización de salida:
table(mydf$MONTH.YEAR)
#
# FEB. 2012 JAN. 2012 MAR. 2012
#         2         2         1

data.frame(table(mydf$MONTH.YEAR))
#        Var1 Freq
# 1 FEB. 2012    2
# 2 JAN. 2012    2
# 3 MAR. 2012    1
Warning: date(): Invalid date.timezone value 'Europe/Kyiv', we selected the timezone 'UTC' for now. in /var/www/agent_stack/data/www/ajaxhispano.com/template/agent.layouts/content.php on line 61
2014-08-13 18:36:47
La función count() en plyr hace lo que usted quiere:
library(plyr)

count(mydf, "MONTH-YEAR")
Warning: date(): Invalid date.timezone value 'Europe/Kyiv', we selected the timezone 'UTC' for now. in /var/www/agent_stack/data/www/ajaxhispano.com/template/agent.layouts/content.php on line 61
2017-10-04 08:00:17
Usando el conjunto de datos de ejemplo que Ananda simuló, aquí hay un ejemplo usando aggregate(), que es parte del núcleo R. aggregate() solo necesita algo para contar como función de los diferentes valores de MONTH-YEAR. En este caso, usé VALUE como la cosa a contar:
aggregate(cbind(count = VALUE) ~ MONTH.YEAR,
          data = mydf,
          FUN = function(x){NROW(x)})
Que te da..
  MONTH.YEAR count
1  FEB. 2012     2
2  JAN. 2012     2
3  MAR. 2012     1
Warning: date(): Invalid date.timezone value 'Europe/Kyiv', we selected the timezone 'UTC' for now. in /var/www/agent_stack/data/www/ajaxhispano.com/template/agent.layouts/content.php on line 61
2014-08-13 20:05:31
library(plyr)
ddply(data, .(MONTH-YEAR), nrow)
Esto le dará la respuesta, si "MES-AÑO" es una variable. Primero, intente unique (data MONTH MONTH-YEAR) y vea si devuelve valores únicos (sin duplicados).
Luego, por encima de simple split-apply-combine devolverá lo que está buscando.
Warning: date(): Invalid date.timezone value 'Europe/Kyiv', we selected the timezone 'UTC' for now. in /var/www/agent_stack/data/www/ajaxhispano.com/template/agent.layouts/content.php on line 61
2014-08-13 18:12:24
Intente usar la función count en dplyr:
library(dplyr)
dat1_frame %>%
    count(MONTH.YEAR)
No estoy seguro de cómo obtuvo MES-AÑO como nombre de variable. Mi versión R no permite tal nombre de variable, así que lo reemplacé con MES.AÑO.
Como nota al margen, el error en su código fue que dat1_frame %.% group_by(MONTH-YEAR) sin una función summarise devuelve el marco de datos original sin ninguna modificación. Por lo tanto, desea utilizar
dat1_frame %>%
    group_by(MONTH.YEAR) %>%
    summarise(count=n())
Warning: date(): Invalid date.timezone value 'Europe/Kyiv', we selected the timezone 'UTC' for now. in /var/www/agent_stack/data/www/ajaxhispano.com/template/agent.layouts/content.php on line 61
2017-05-05 22:35:12
Solo para completar los datos.tabla solución:
library(data.table)

mydf <- structure(list(ID = c(110L, 111L, 121L, 131L, 141L),
                       MONTH.YEAR = c("JAN. 2012", "JAN. 2012",
                                      "FEB. 2012", "FEB. 2012",
                                      "MAR. 2012"),
                       VALUE = c(1000L, 2000L, 3000L, 4000L, 5000L)),
                  .Names = c("ID", "MONTH.YEAR", "VALUE"),
                  class = "data.frame", row.names = c(NA, -5L))

setDT(mydf)
mydf[, .(`Number of rows` = .N), by = MONTH.YEAR]

   MONTH.YEAR Number of rows
1:  JAN. 2012              2
2:  FEB. 2012              2
3:  MAR. 2012              1
Warning: date(): Invalid date.timezone value 'Europe/Kyiv', we selected the timezone 'UTC' for now. in /var/www/agent_stack/data/www/ajaxhispano.com/template/agent.layouts/content.php on line 61
2017-05-16 13:49:02
Aquí hay otra forma de usar aggregate para contar filas por grupo:
my.data <- read.table(text = '
    month.year    my.cov
      Jan.2000     apple
      Jan.2000      pear
      Jan.2000     peach
      Jan.2001     apple
      Jan.2001     peach
      Feb.2002      pear
', header = TRUE, stringsAsFactors = FALSE, na.strings = NA)

rows.per.group  <- aggregate(rep(1, length(my.data$month.year)),
                             by=list(my.data$month.year), sum)
rows.per.group

#    Group.1 x
# 1 Feb.2002 1
# 2 Jan.2000 3
# 3 Jan.2001 2
Warning: date(): Invalid date.timezone value 'Europe/Kyiv', we selected the timezone 'UTC' for now. in /var/www/agent_stack/data/www/ajaxhispano.com/template/agent.layouts/content.php on line 61
2017-01-14 15:26:34
Supongamos que tenemos un marco de datos df_data como se muestra a continuación
> df_data
   ID MONTH-YEAR VALUE
1 110   JAN.2012  1000
2 111   JAN.2012  2000
3 121   FEB.2012  3000
4 131   FEB.2012  4000
5 141   MAR.2012  5000
Para contar el número de filas en df_data agrupadas por columna MES-AÑO, puede usar:
> summary(df_data$`MONTH-YEAR`)

FEB.2012 JAN.2012 MAR.2012
   2        2        1
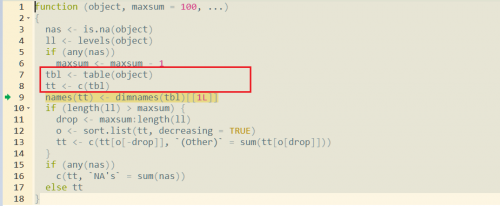 la función summary creará una tabla a partir del argumento factor, luego creará un vector para el resultado (línea 7 & 8)
Warning: date(): Invalid date.timezone value 'Europe/Kyiv', we selected the timezone 'UTC' for now. in /var/www/agent_stack/data/www/ajaxhispano.com/template/agent.layouts/content.php on line 61
2016-07-22 04:09:28