Coordenadas de la parcela en el mapa
Estoy tratando de trazar mis coordenadas usando R. Ya he intentado seguir diferentes post (R: Trazar coordenadas agrupadas en el mapa del mundo ; Trazando coordenadas de múltiples puntos en el mapa de Google en R) pero no estoy teniendo mucho éxito con mis datos.
Estoy tratando de lograr un mapa plano del mundo con mi coordenada gps como puntos de colores (cada área un color específico):
area         lat    long
Agullhas    -38,31  40,96
Polar       -57,59  76,51
Tasmanian   -39,47  108,93

library(RgoogleMaps)
lat <- c(-38.31, -35.50) #define our map's ylim
lon <- c(40.96,37.50) #define our map's xlim
center = c(mean(lat), mean(lon))  #tell what point to center on
zoom <- 2 #zoom: 1 = furthest out (entire globe), larger numbers = closer in
terrmap <- GetMap(center=center, zoom=zoom, maptype= "satallite", destfile = "satallite.png")
Problema que ahora no sé cómo agregar mis puntos y me gustará un color para cada región.
¿Podría alguien ayudarme a seguir adelante con ello?
La otra opción que he intentado es :
library(maps)
library(mapdata)
library(maptools)
map(database= "world", ylim=c(-38.31, -35.5), xlim=c(40.96, 37.5), col="grey80", fill=TRUE, projection="gilbert", orientation= c(90,0,225))
lon <- c(-38.31, -35.5)  #fake longitude vector
lat <- c(40.96, 37.5)  #fake latitude vector
coord <- mapproject(lon, lat, proj="gilbert", orientation=c(90, 0, 225))  #convert points to projected lat/long
points(coord, pch=20, cex=1.2, col="red")  #plot converted points
Pero las coordenadas terminan en una posición incorrecta y no estoy seguro de por qué
Espero que alguien pueda ayudar
3 answers
Como alternativa a RgoogleMaps, también puede usar la combinación ggplot2 con ggmap.
Con este código:
# loading the required packages
library(ggplot2)
library(ggmap)
# creating a sample data.frame with your lat/lon points
lon <- c(-38.31,-35.5)
lat <- c(40.96, 37.5)
df <- as.data.frame(cbind(lon,lat))
# getting the map
mapgilbert <- get_map(location = c(lon = mean(df$lon), lat = mean(df$lat)), zoom = 4,
maptype = "satellite", scale = 2)
# plotting the map with some points on it
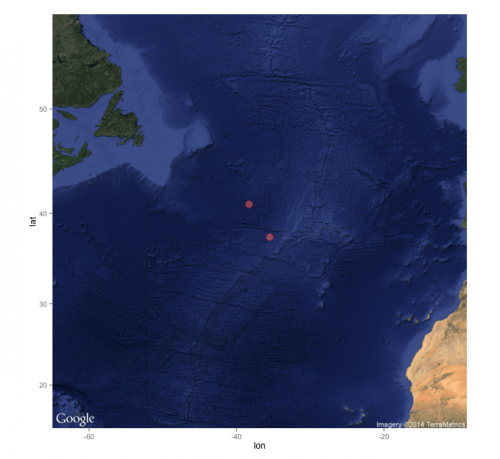
ggmap(mapgilbert) +
geom_point(data = df, aes(x = lon, y = lat, fill = "red", alpha = 0.8), size = 5, shape = 21) +
guides(fill=FALSE, alpha=FALSE, size=FALSE)
Se obtiene este resultado:
Warning: date(): Invalid date.timezone value 'Europe/Kyiv', we selected the timezone 'UTC' for now. in /var/www/agent_stack/data/www/ajaxhispano.com/template/agent.layouts/content.php on line 61
2015-11-06 09:14:51
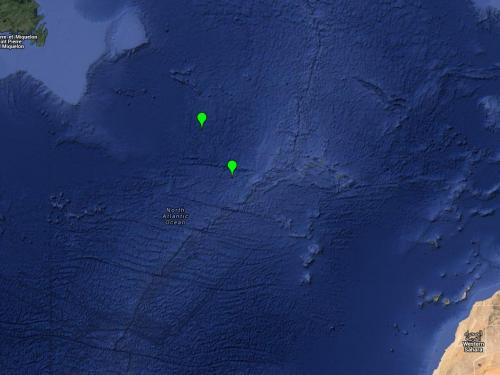
Otra alternativa, es el paquete plotGoogleMaps que permite trazar en un navegador, permitiendo acercar y alejar, etc. A continuación, puede hacer una captura de pantalla de su imagen para guardarla (aunque recuerde que Google maps se supone legalmente que se utiliza para Internet).
 library("plotGoogleMaps")
 lat <- c(-38.31, -35.50) #define our map's ylim
 lon <- c(40.96,37.50) #define our map's xlim

 # make your coordinates a data frame
 coords <- as.data.frame(cbind(lon=lon,lat=lat))

 # make it a spatial object by defining its coordinates in a reference system
 coordinates(coords) <- ~lat+lon

 # you also need a reference system, the following should be a fine default
 proj4string(coords) <- CRS("+init=epsg:4326")
 # Note: it is a short for:
 CRS("+init=epsg:4326")
 > CRS arguments:
 >  +init=epsg:4326 +proj=longlat +datum=WGS84 +no_defs +ellps=WGS84 +towgs84=0,0,0

 # then just plot
 a <- plotGoogleMaps(coords)
 # here `a <-` avoids that you get flooded by the html version of what you plot
Y obtienes :
Warning: date(): Invalid date.timezone value 'Europe/Kyiv', we selected the timezone 'UTC' for now. in /var/www/agent_stack/data/www/ajaxhispano.com/template/agent.layouts/content.php on line 61
2015-11-03 09:18:17
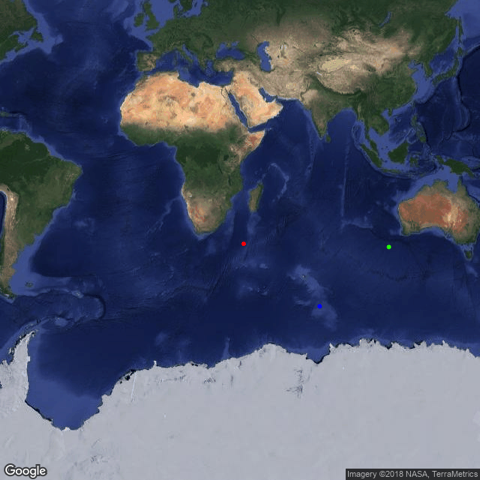
Aquí hay una solución utilizando solo Rgooglemaps, según lo solicitado por el usuario.
# get map (from askers OP, except changed map type = "Satallite" to type = "Satellite")
library(RgoogleMaps)
lat <- c(-38.31, -35.50) #define our map's ylim
lon <- c(40.96,37.50) #define our map's xlim
center = c(mean(lat), mean(lon))  #tell what point to center on
zoom <- 2 #zoom: 1 = furthest out (entire globe), larger numbers = closer in
terrmap <- GetMap(center=center, zoom=zoom, type= "satellite", destfile = "satellite.png")

# plot points and save image
lat <- c(-38.31, -57.59, -39.47)
lon <- c(40.96, 76.51, 108.93)
png('map.png')
PlotOnStaticMap(terrmap, lat = lat, lon = lon, pch = 20, col = c('red', 'blue', 'green'))
dev.off()
Warning: date(): Invalid date.timezone value 'Europe/Kyiv', we selected the timezone 'UTC' for now. in /var/www/agent_stack/data/www/ajaxhispano.com/template/agent.layouts/content.php on line 61
2018-03-01 22:19:39