Agregar una línea de regresión en un ggplot
Estoy tratando de agregar una línea de regresión en un ggplot. Primero intenté con Abline pero no logré que funcionara. Entonces probé esto...
data = data.frame(x.plot=rep(seq(1,5),10),y.plot=rnorm(50))
ggplot(data,aes(x.plot,y.plot))+stat_summary(fun.data=mean_cl_normal) +
   geom_smooth(method='lm',formula=data$y.plot~data$x.plot)
Pero tampoco está funcionando.
4 answers
En general, para proporcionar su propia fórmula debe usar argumentos x y y que corresponderán a los valores que proporcionó en ggplot() - en este caso x se interpretará como x.plot y y como y.plot. Puede encontrar más información sobre los métodos de suavizado y la fórmula en la página de ayuda de function stat_smooth(), ya que es la estadística predeterminada utilizada por geom_smooth().
ggplot(data,aes(x.plot,y.plot))+stat_summary(fun.data=mean_cl_normal) +
  geom_smooth(method='lm',formula=y~x)
Si está utilizando los mismos valores x e y que suministró en la llamada ggplot() y necesita trazar una línea de regresión lineal, entonces no necesita usar la fórmula dentro de geom_smooth(), solo proporcione el method="lm".
ggplot(data,aes(x.plot,y.plot))+stat_summary(fun.data=mean_cl_normal) +
  geom_smooth(method='lm')
Warning: date(): Invalid date.timezone value 'Europe/Kyiv', we selected the timezone 'UTC' for now. in /var/www/agent_stack/data/www/ajaxhispano.com/template/agent.layouts/content.php on line 61
2013-03-27 08:43:42
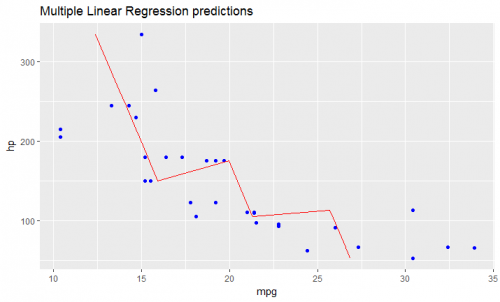
Como acabo de imaginar, en caso de que tenga un modelo ajustado en regresión lineal múltiple, la solución mencionada anteriormente no funcionará.
Tiene que crear su línea manualmente como un dataframe que contenga valores predichos para su dataframe original (en su caso data).
Se vería así:
# read dataset
df = mtcars

# create multiple linear model
lm_fit <- lm(mpg ~ cyl + hp, data=df)
summary(lm_fit)

# save predictions of the model in the new data frame
# together with variable you want to plot against
predicted_df <- data.frame(mpg_pred = predict(lm_fit, df), hp=df$hp)

# this is the predicted line of multiple linear regression
ggplot(data = df, aes(x = mpg, y = hp)) +
  geom_point(color='blue') +
  geom_line(color='red',data = predicted_df, aes(x=mpg_pred, y=hp))
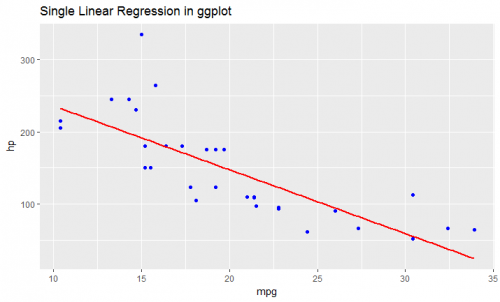
# this is predicted line comparing only chosen variables
ggplot(data = df, aes(x = mpg, y = hp)) +
  geom_point(color='blue') +
  geom_smooth(method = "lm", se = FALSE)
Warning: date(): Invalid date.timezone value 'Europe/Kyiv', we selected the timezone 'UTC' for now. in /var/www/agent_stack/data/www/ajaxhispano.com/template/agent.layouts/content.php on line 61
2017-09-14 10:47:39
Si desea ajustar otro tipo de modelos, como una curva dosis-respuesta utilizando modelos logísticos, también necesitaría crear más puntos de datos con la función predecir si desea tener una línea de regresión más suave:
Ajuste: su ajuste de una curva de regresión logística
#Create a range of doses:
mm <- data.frame(DOSE = seq(0, max(data$DOSE), length.out = 100))
#Create a new data frame for ggplot using predict and your range of new
#doses:
fit.ggplot=data.frame(y=predict(fit, newdata=mm),x=mm$DOSE)

ggplot(data=data,aes(x=log10(DOSE),y=log(viability)))+geom_point()+
geom_line(data=fit.ggplot,aes(x=log10(x),y=log(y)))
Warning: date(): Invalid date.timezone value 'Europe/Kyiv', we selected the timezone 'UTC' for now. in /var/www/agent_stack/data/www/ajaxhispano.com/template/agent.layouts/content.php on line 61
2018-03-02 21:59:04
Encontré esta función en un blog
 ggplotRegression <- function (fit) {

    `require(ggplot2)

    ggplot(fit$model, aes_string(x = names(fit$model)[2], y = names(fit$model)[1])) +
      geom_point() +
      stat_smooth(method = "lm", col = "red") +
      labs(title = paste("Adj R2 = ",signif(summary(fit)$adj.r.squared, 5),
                         "Intercept =",signif(fit$coef[[1]],5 ),
                         " Slope =",signif(fit$coef[[2]], 5),
                         " P =",signif(summary(fit)$coef[2,4], 5)))
    }`
Una vez cargada la función, simplemente
ggplotRegression(fit)
También puedes ir por ggplotregression( y ~ x + z + Q, data)
Espero que esto ayude.
Warning: date(): Invalid date.timezone value 'Europe/Kyiv', we selected the timezone 'UTC' for now. in /var/www/agent_stack/data/www/ajaxhispano.com/template/agent.layouts/content.php on line 61
2018-07-03 18:08:15